Interactive organizational charts have become vital for modern organizations to visualize their team and department structures.
It helps companies optimize their resources. Interactive organizational chart also improves cross-functional teamwork and enhances team communication.
This blog will explain the importance of an interactive org chart. Additionally, we’ll provide a step-by-step guide on creating one for your company. Let’s get started!
An organizational chart is a visual representation of a company’s structure, showing roles, departments, and reporting relationships.
Organizational charts outline how teams are organized, who reports to whom, and how different roles and departments are interconnected within the company. The primary goal of an org chart is to illustrate the formal structure of an organization to facilitate:
- Clarity in roles and responsibilities
- Efficient communication
- Effective decision-making processes
- Transparency in workflow and command chains
Types of Org Charts
There are two main types of org charts: traditional and interactive.
Modern organizations now prefer an interactive org chart, or dynamic org chart, because of several benefits:
-
It enables greater collaboration within the organization.
-
It allows teams to view and modify the graph in real-time.
-
It offers a better understanding of how different teams and individuals work together.
-
It identifies knowledge gaps and potential areas for improvement.
-
It promotes better communication and teamwork.
The traditional and static org chart is no longer efficient.
Interactive org charts help enhance transparency and communication within the organization. It allows employees to understand their role in the bigger picture. Ultimately, this approach leads to better engagement with the company's goals.
Using Interactive org charts can streamline decision-making processes. Team leaders can quickly spot areas that need changes and make more informed decisions based on real-time data.
Interactive org charts can benefit organizations in compliance and reporting.
Organizations can maintain accurate and up-to-date information on employees. As a result, the leadership can ensure that everything complies with regulations and laws. They can also use this data to identify trends and areas for improvement.
Org chart tools are designed to help users create charts quickly and easily, manage them and visualize the internal structure of an organization by mapping out roles, departments, and reporting relationships in a clear, hierarchical format.
Organizational chart software typically come with a range of features and tools. such as drag-and-drop interfaces, data import options, and customization tools that allow users to build clear, professional, and detailed charts with minimal effort.
The org chart maker can also automatically update charts as organizational changes occur. It makes it easier to keep them current.
Traditional organizational charts, on the other hand, involve using basic graphic design software to create an org chart manually. It requires more time and effort, especially when making changes or updating the chart.
For example, the graph must be redrawn or modified manually if an employee leaves or changes positions.
The traditional methods can be time-consuming and may result in errors or inconsistencies.
The best org chart creator for your organization should include a few essential features. Here’s what to look for when choosing the right org chart tool.
-
Drag and drop mapping: makes moving people around and creating departments easy.
-
Team accountabilities feature: ensures that everyone has the right responsibilities.
-
Scenario builder: enables the collaborative design of future states.
-
Function mapping: identifies functional gaps and overlaps.
-
Single source of truth: provides a copy of the current org chart for sharing and export.
-
Align responsibilities: assigns roles and positions strategically to achieve total internal alignment.
-
Job description export: instantly builds responsibility-based job descriptions.
-
Invite and collaborate: allows other team members to work on the charts.
-
Live link creation: provides unlimited and view-only access to all the charts.
-
Chart export: shares charts with desired teams in one click.
-
Integrations: keeps the data in sync across HRIS and business tools.
-
Real-time reporting: shows the company's people data in one place.
-
Color grouping: helps identify different departments quickly.
-
Vacancy planning: helps teams prepare for upcoming job openings and create position accountabilities based on needs.
-
Multiple roles feature: shows people who cover numerous internal functions, helping companies understand unique workloads.
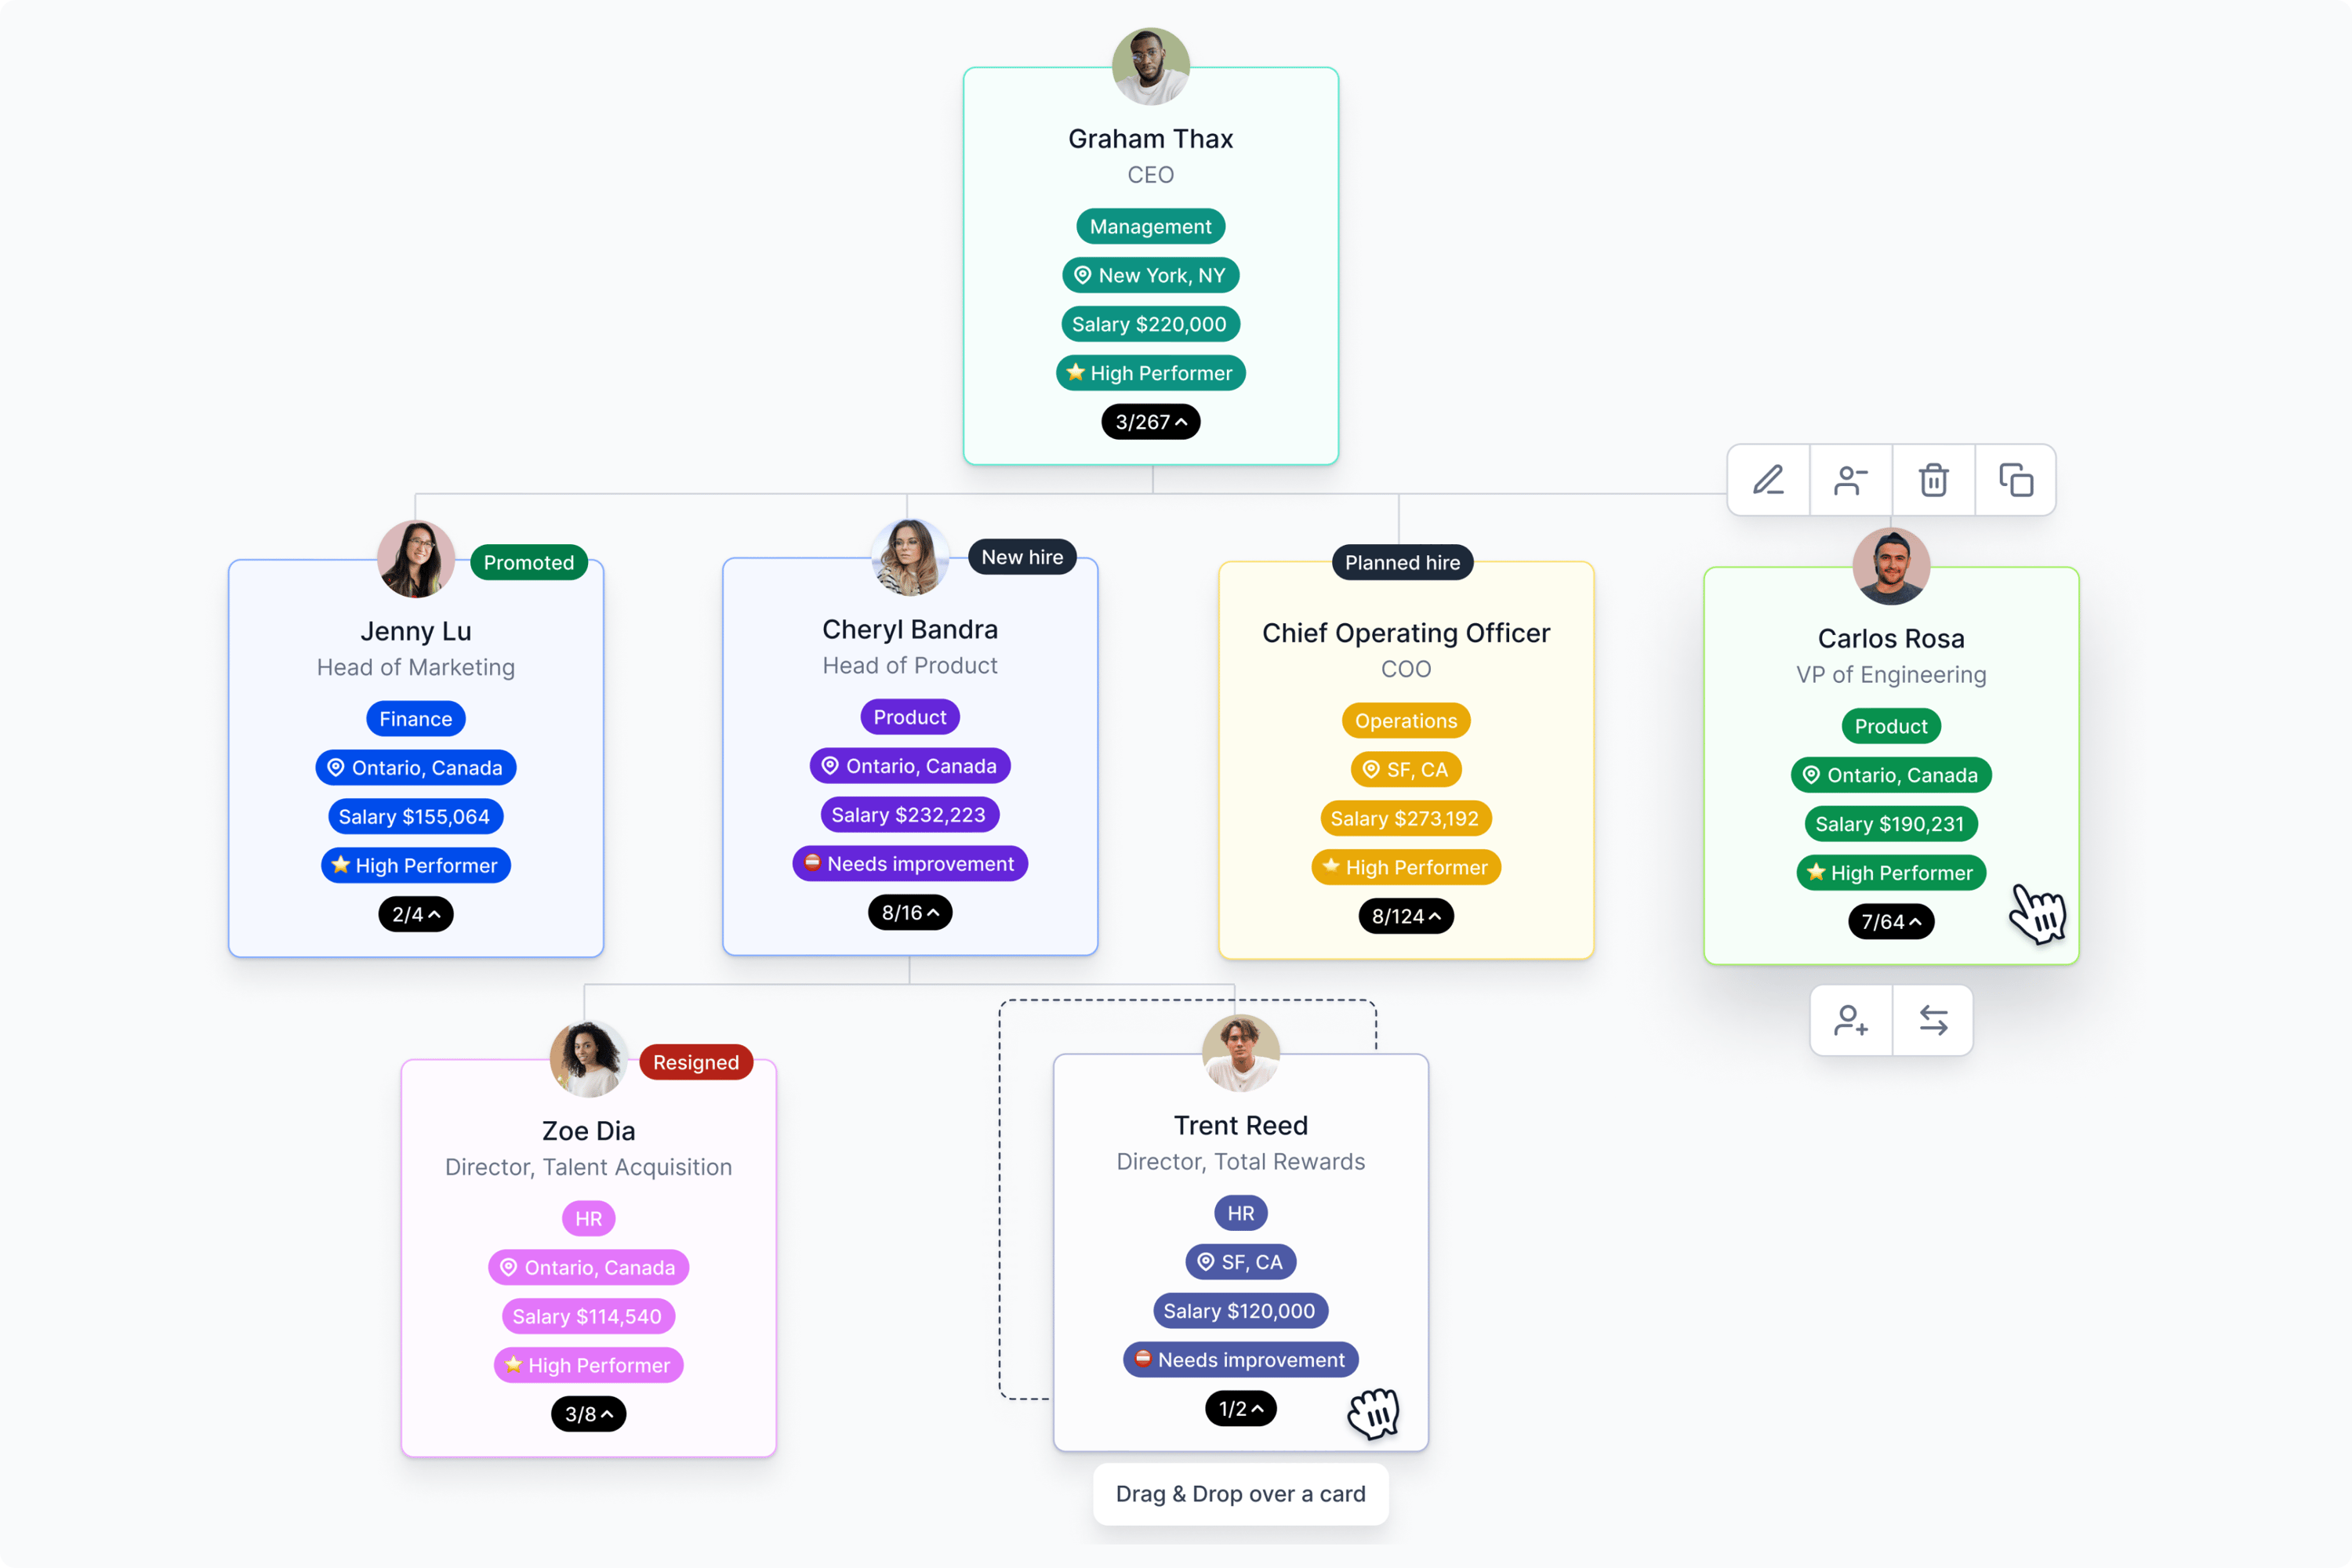
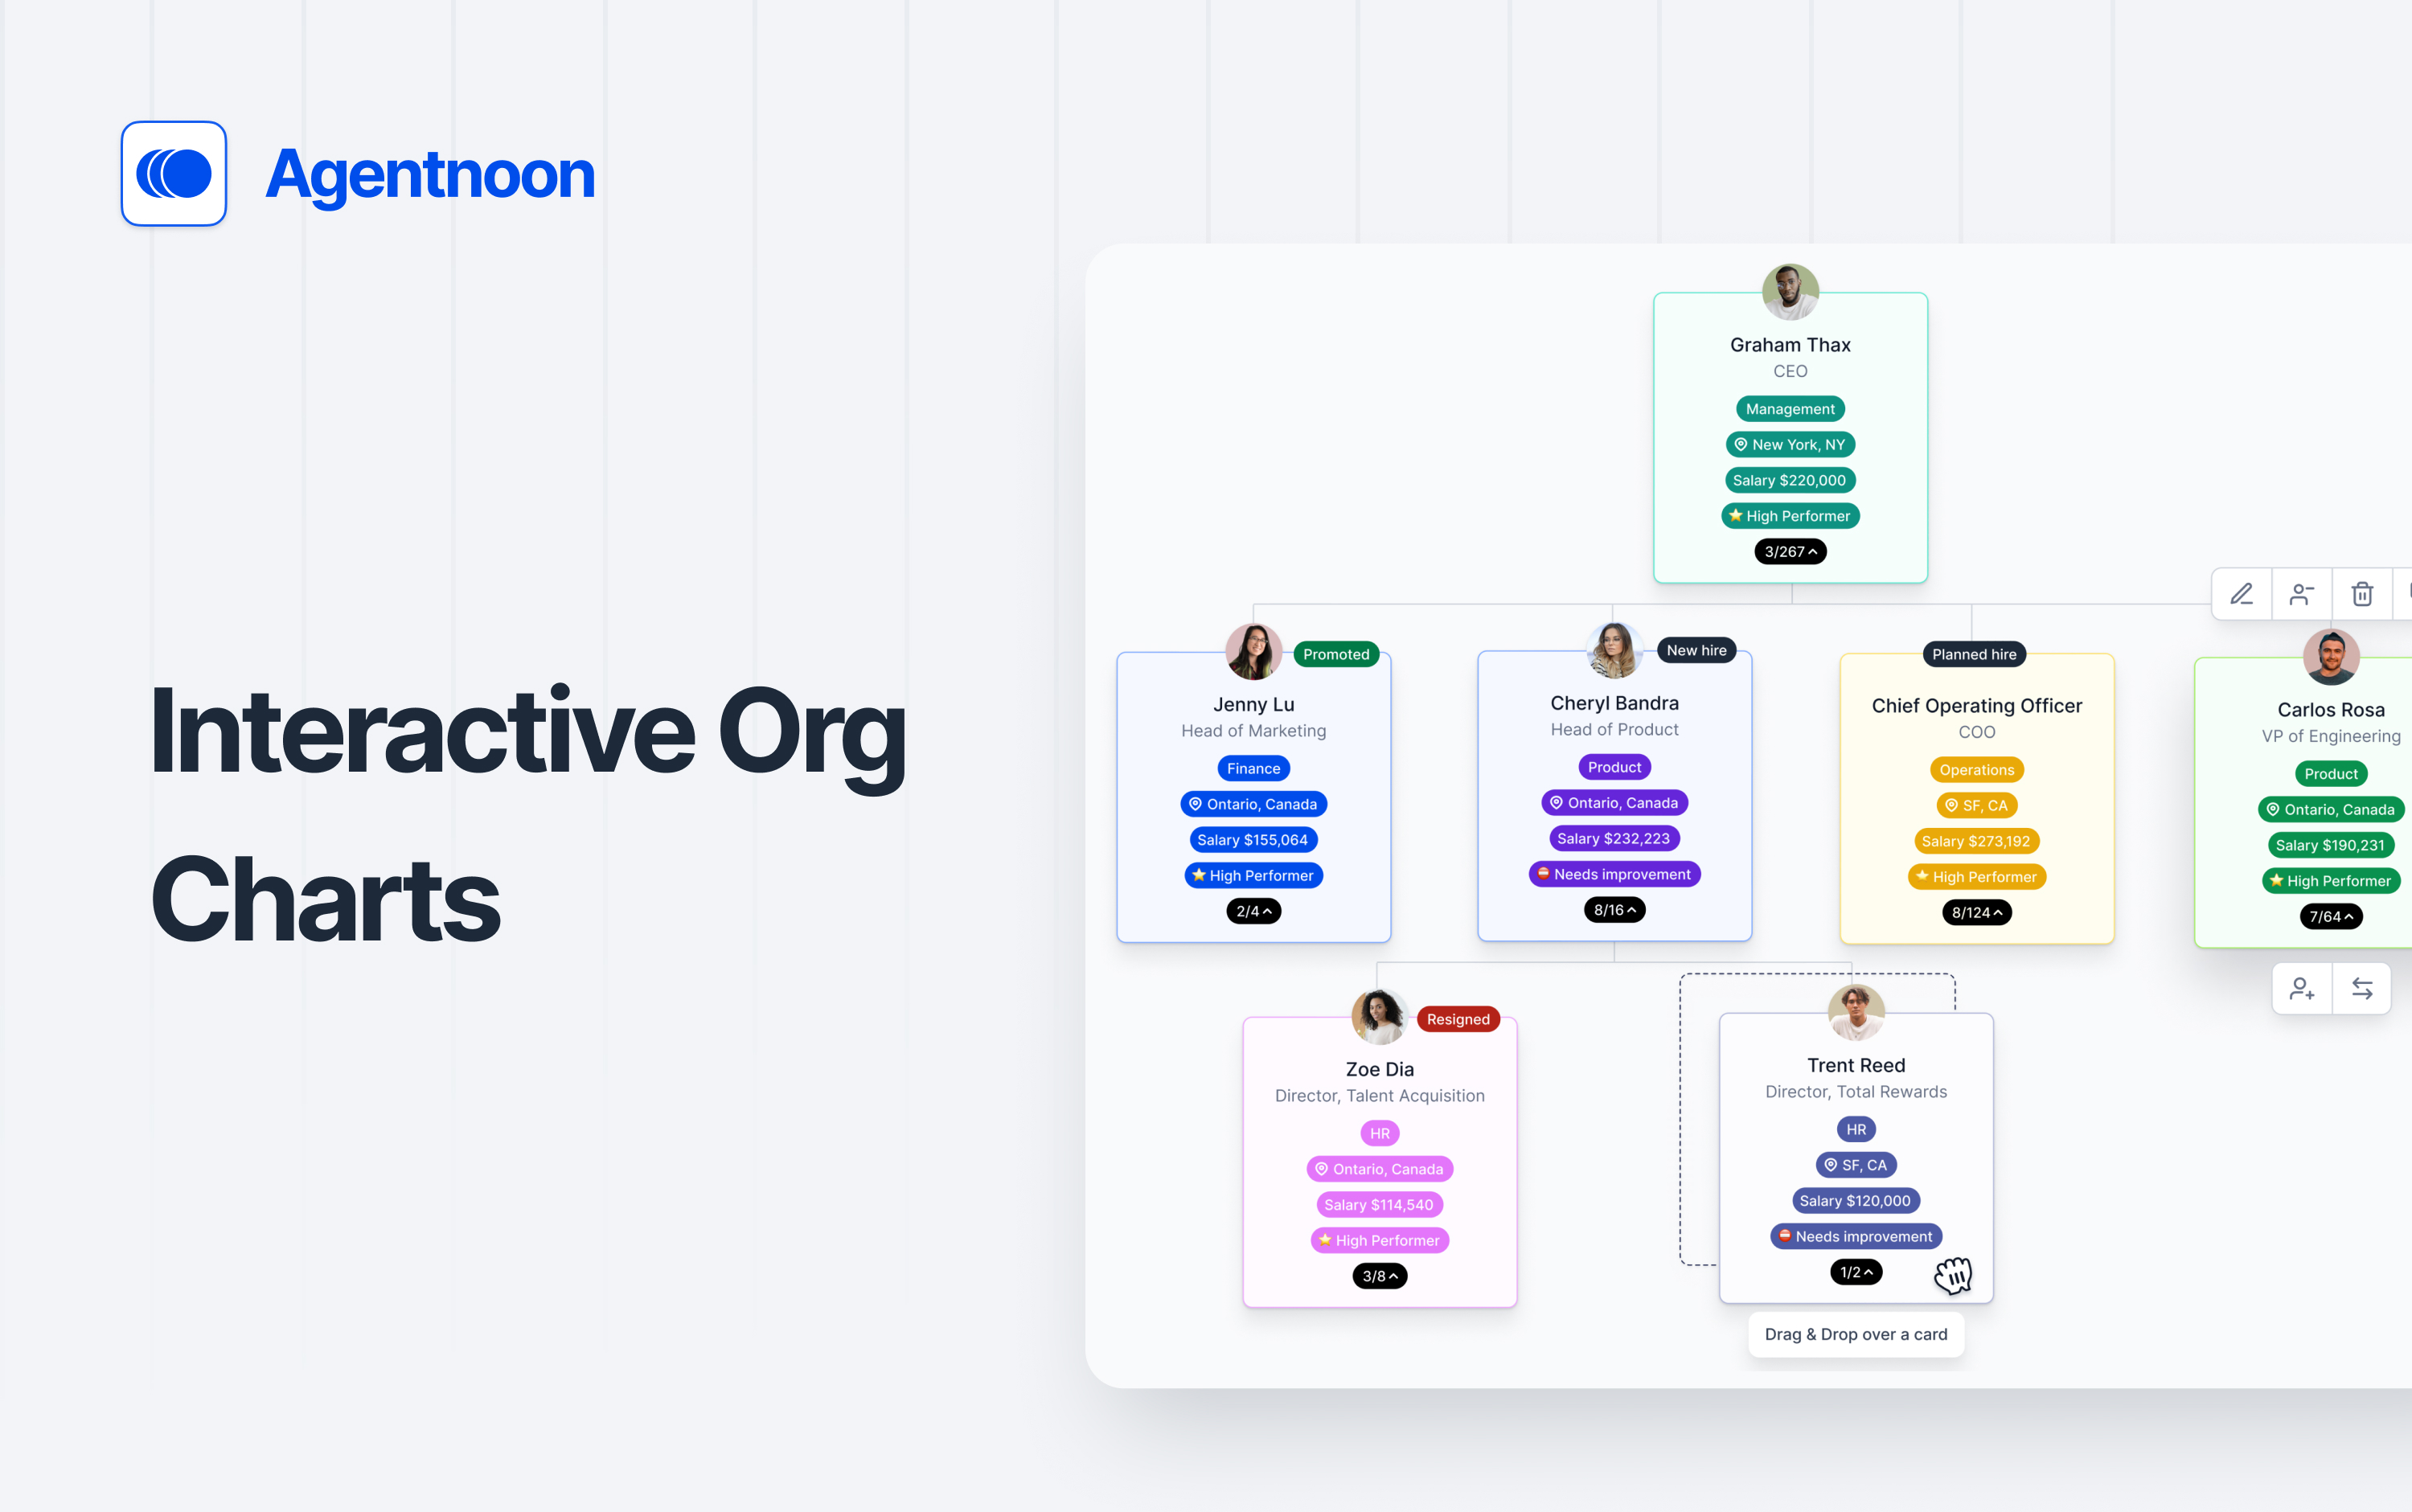
Agentnoon org chart software provides an easy-to-use and interactive organizational chart for your business. Our software works well with all your systems and allows you to export data in just one click.
In addition, Agentnoon allows you to visualize all your people data and plan future headcount changes.
Our software offers live integration with 100+ HRIS tools and real-time sync to keep your data updated 24/7. Moreover, Agentnoon provides powerful analytics for your entire organizational structure.
Creating an interactive org chart can greatly enhance organizational efficiency . Follow these step-by-step instructions to design one:
-
Choose the right org chart tool.
Select the org chart software that best suits your company’s needs and objectives.
-
Import data.
Next, import your people data. The tool automatically creates a basic org chart based on the uploaded data.
-
Add and organize employees.
Once the data is imported, you can add and arrange your workforce. You can add new employees or change existing positions.
-
Customize the chart's appearance.
You can customize the org chart's colors, fonts, and layouts to make it more visually appealing.
-
Add interactivity and links.
This step lets viewers click on an employee's name and view their profile, with additional information like contact details, job responsibilities, and performance metrics.
-
Share the org chart.
Finally, you can share and collaborate on the completed org chart in real time.
Creating and updating organizational charts can be simplified with automatic organizational charts.
Automatic org charts use technology to automatically generate graphs based on the data entered into the system.
Using automatic org charts helps organizations:
-
Save time on creating charts.
-
Eliminate manual updates.
-
Customize the charts to suit the business’s specific requirements.
-
Ensure that the chart precisely represents the organization's structure and hierarchy.
-
Identify gaps in team structure.
-
Highlight areas for additional talents.
-
Make more informed decisions regarding hiring and staffing.
-
Improve organizational efficiency.
Smart organizational charts are an innovative way to visualize the structure of an organization.
The creation of smart org charts involves AI and machine learning. It makes the process more accurate and efficient. The technology can analyze data from various sources and create an org chart based on the company's needs.
The benefits of using smart org charts are numerous, including:
-
Identify skill gaps and optimize workforce planning.
-
Provide in-depth insights on various factors such as employee performance and turnover rates.
-
Improve communication and collaboration.
-
Allow for quick and easy updates as the company grows and changes.
-
Enhance organizational efficiency.
-
Allow for more agile and responsive organizations.
-
Help adapt to changing market conditions quickly.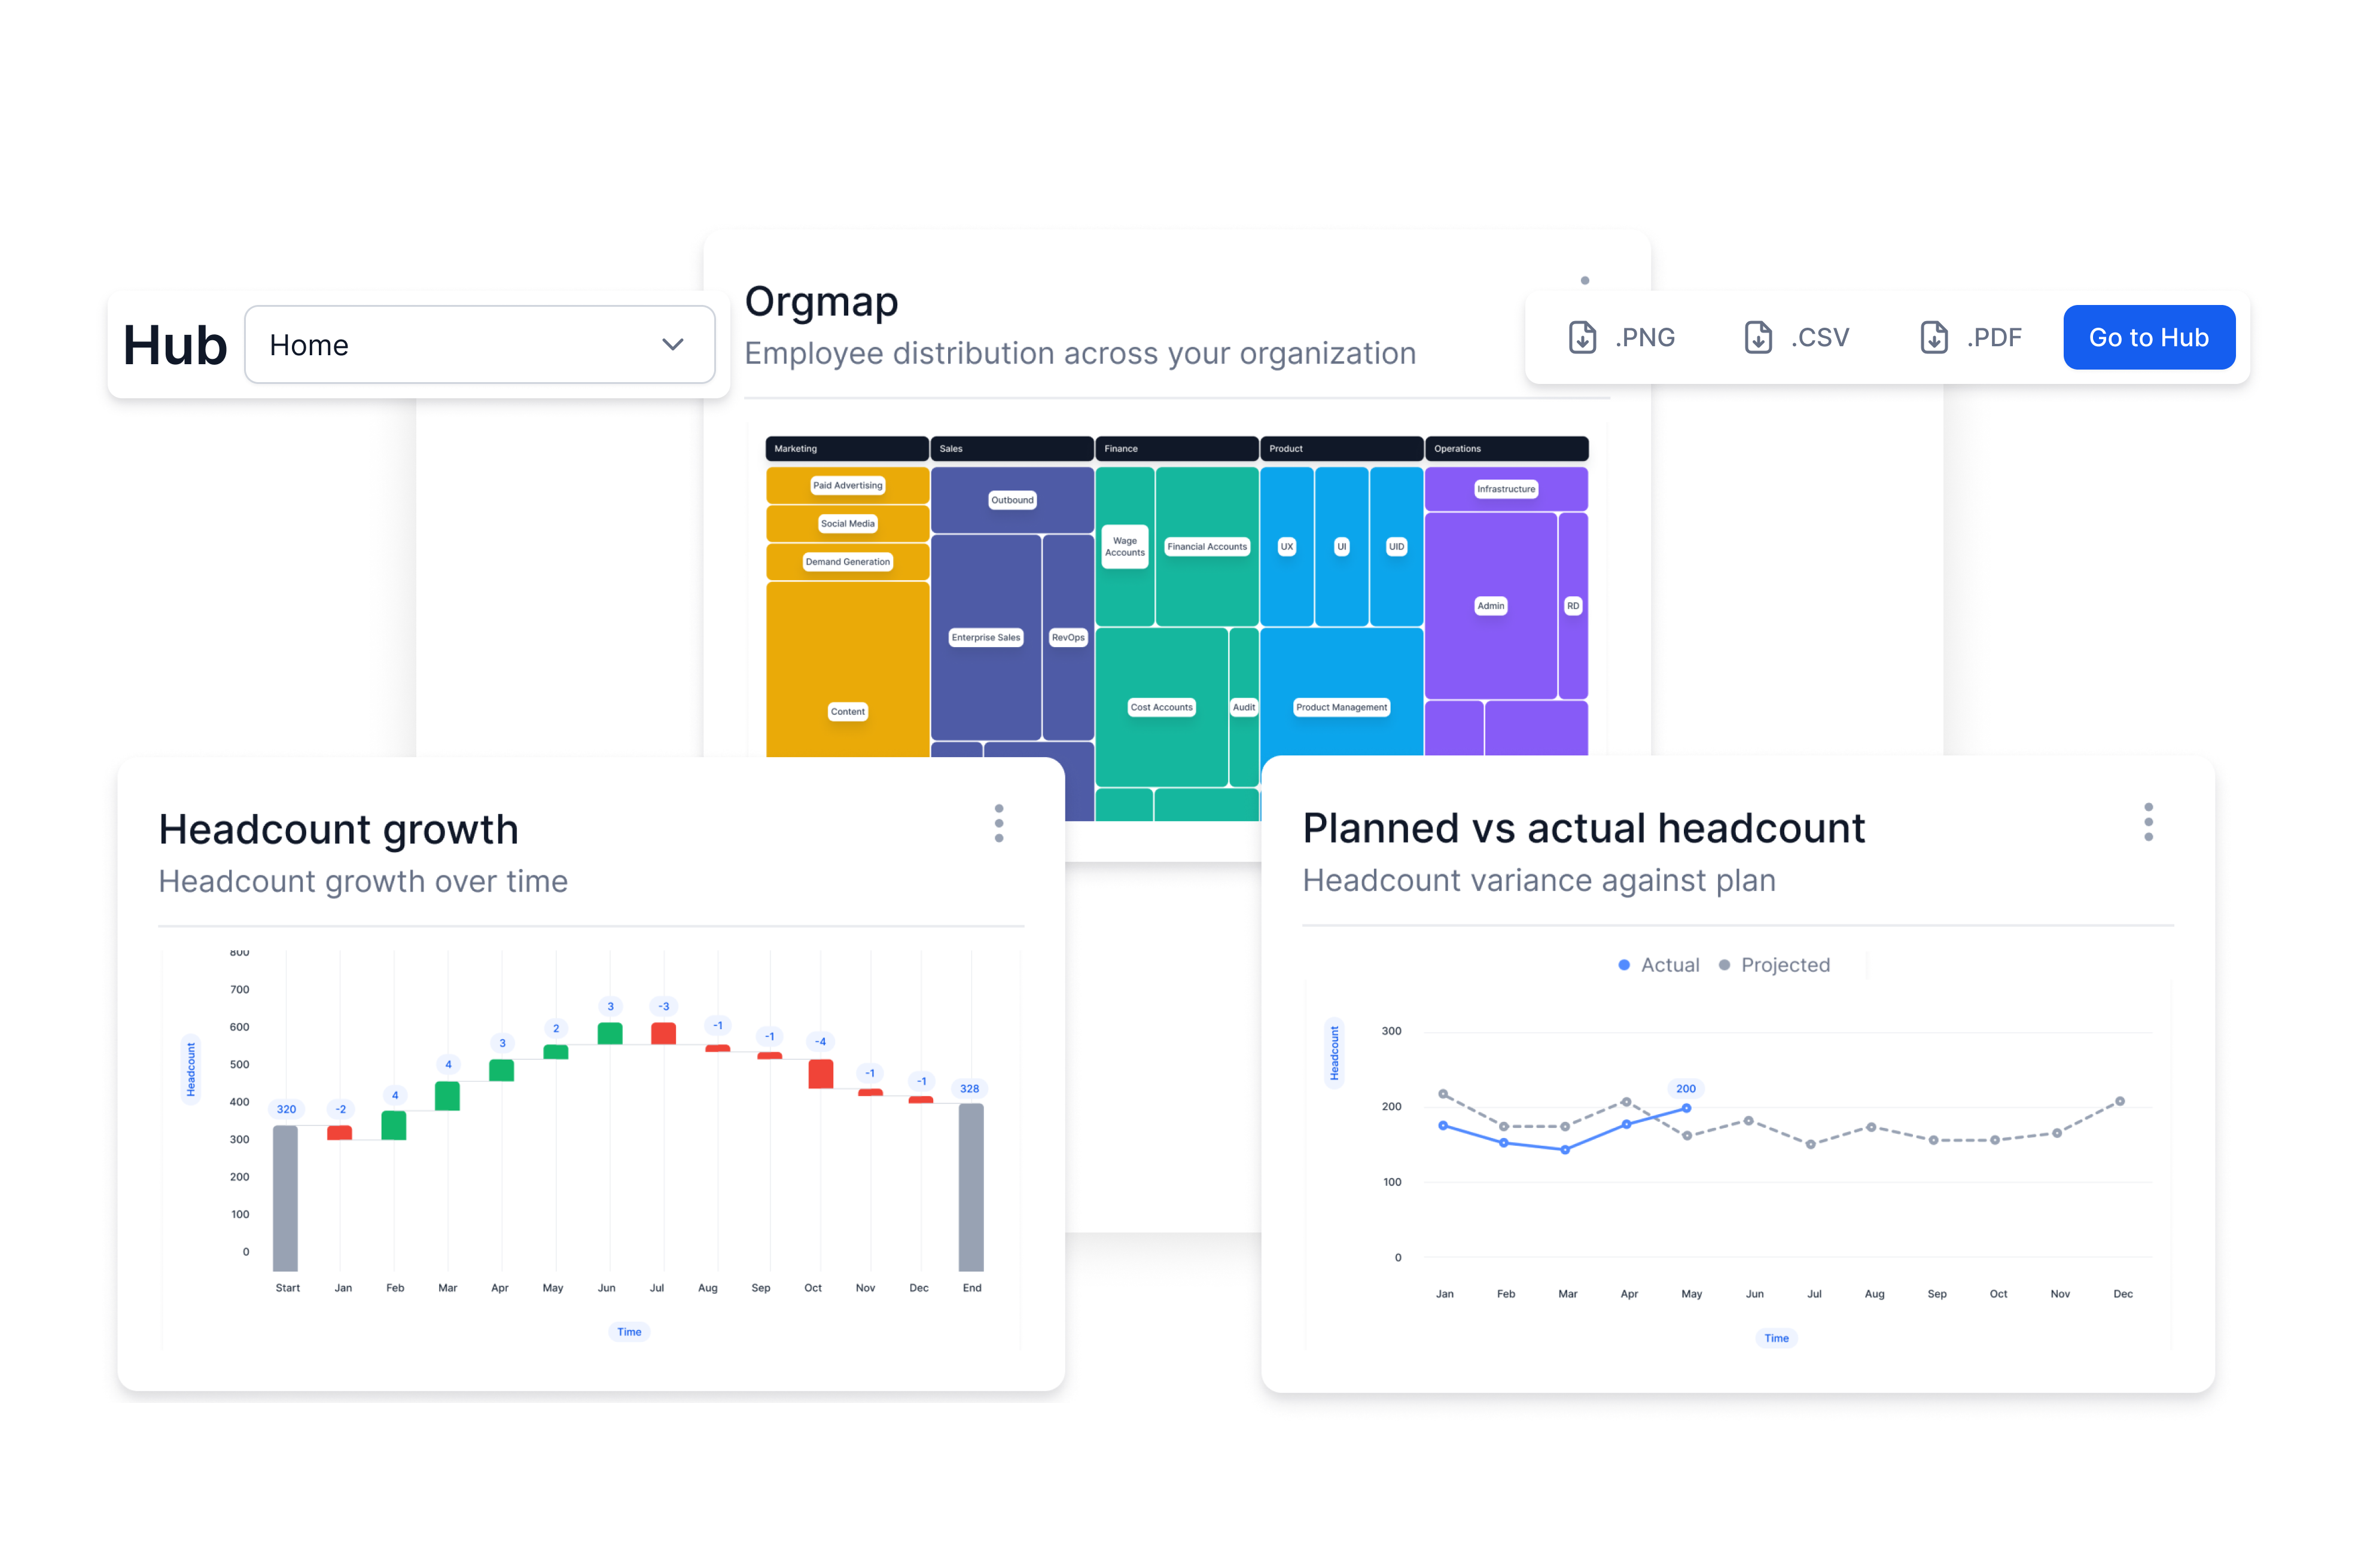
Interactive organizational charts are essential for modern organizations. These charts help companies optimize resources, improve cross-functional teamwork, and enhance communication.
Nowadays, creating an interactive org chart can be quickly done using an org chart tool. When selecting an org chart software, consider features such as drag-and-drop mapping, team accountabilities, and real-time reporting.
About Agentnoon:
Agentnoon is a workforce planning and organizational design software for responsible growth. We help you visualize all your people data in one place.
Try Agentnoon's org chart software yourself. Sign up for a free sandbox and create an interactive org chart for your company.
Organizational visualization made easy!